Survey Reporting
We have different types of reporting involving Surveys.
One is the Survey agent Reporting, which includes the Respones and the Agent Activity. The other is the reporting of any other agent (AB Test or MVT) which has at least one survey linked to it. On this documentation page we will cover both scenarios.
Survey Agent Reporting
Lets say we have the following Survey Agent

There are 2 reporting tabs we can access from the Survey Agent's home: Respones and Activity.
Responses
If we click on Responses, we are taken to the following screen:

The Responses tab shows as a table view of every response to every question (one in each column). On top of that, there are added columns that display Visitor Data and when linked, variations from the linked agents.
In the example above we have 4 responses, all with answers to one NPS question named "enjoy", which ocurred on their own (not under any "First A/B Test" variation), all on weekdays, from international visitors, on desktop, and so on.
On the right side bar, we see we have multiple dropdown menus. When clicked, they open up and shows summary counts for every question and answer broken down by each field, like below
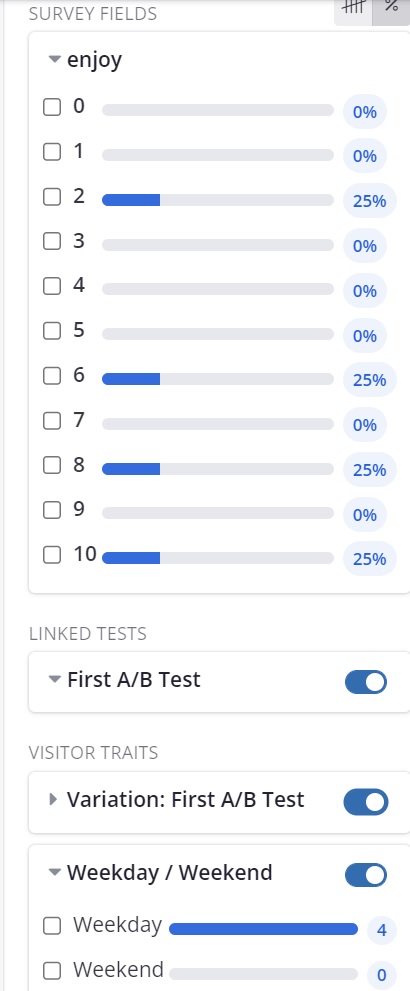
Clicking on the little blue "switch" button removes or adds the said dimension as a column to the table view.
Activity
The activity tab is just like your regular agent's activity view. It includes summary counts of the agents variations (Survey Offered or Not). How many visitors, answers, average answer/score, how many times the survey was actually offered and submitted and so on, as shown below:

Activity ReportsFor more detailed information as to what the Activity Reports displays you can visit our Activity Report page.
Agents with Linked Surveys
When either an AB Testing or MVT agent gets at least one survey linked to it, we can measure the impact that serving said survey had on the variations. This data is accessible from the testing agent reporting tabs rather than from the Survey agent.
So for example if we go to one of such agents and then access the Activity Tab, we'll see that from the right sidebar we can now add Survey related actions like questions answered or if the survey was offered and submitted overall as new columns into the table.

Similar thing can be done on the Testing tab, only this time we can look at how each variation performs against Survey goals like answering a specific question (and its value when numeric), or being offered and submitting the survey overall, like shown below.

Testing ReportFor more detailed information as to what the Activity Reports displays you can visit our AB Testing Report page.
Updated over 1 year ago