A/B Testing Report
Overview and Purpose
The Conductrics A/B Testing Report provides the following:
- How well each variation is performing based on the targeted goals
- How much uncertainty there is in our estimate of the above
- How much better each variation is performing over the baseline (control)
- If the results in 3 provide robust evidence that a variation is likely to perform better than the baseline or if it is likely due to random noise.
- How well the Conductrics Predictive targeting engine (if applicable) is performing compared to the baseline.
Report Areas
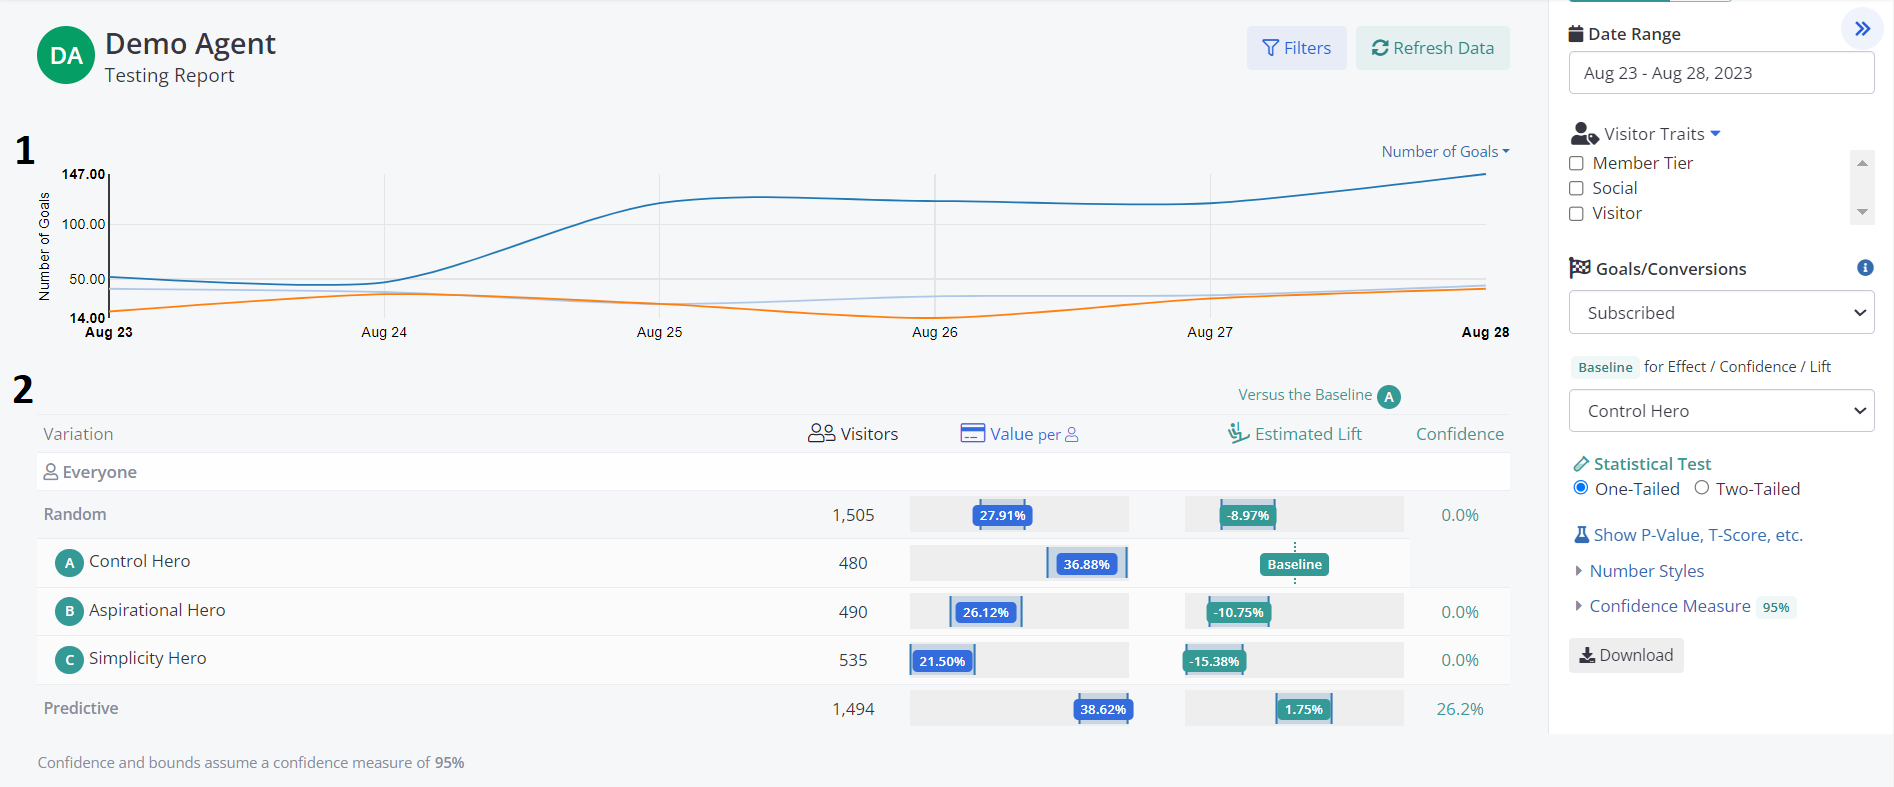
Results-By-Day Chart
This chart plots either the Number of Goals, the Number of Selections or the Values of goals per selection broken down by variant, across the Date Range selected.
Test Results Table
This is the main section of the report.
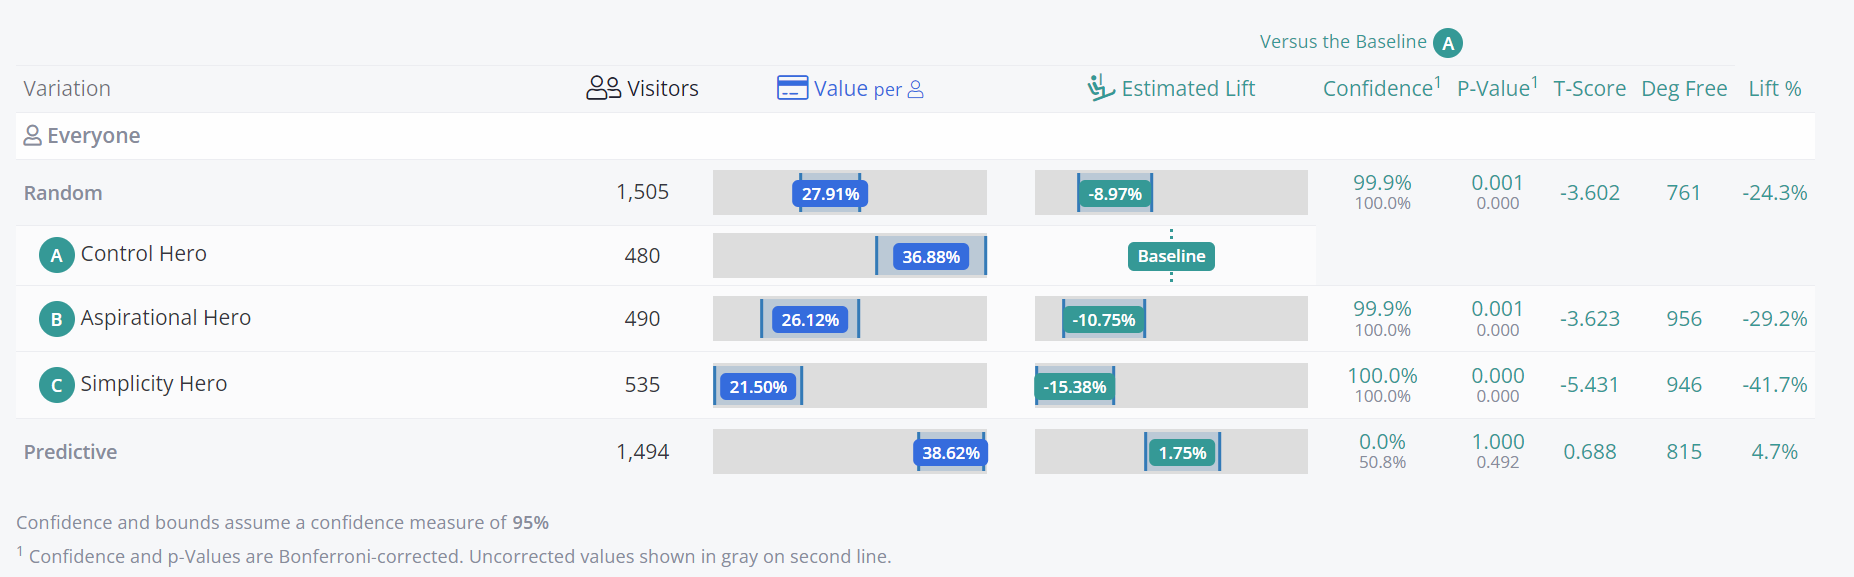
Variation - a row for each variation (or combination of variations for MVT Experiments).
Visitors - is the number of times the variation was assigned to a new visitor by Conductrics. Note that repeat views or visits do not increment this number.
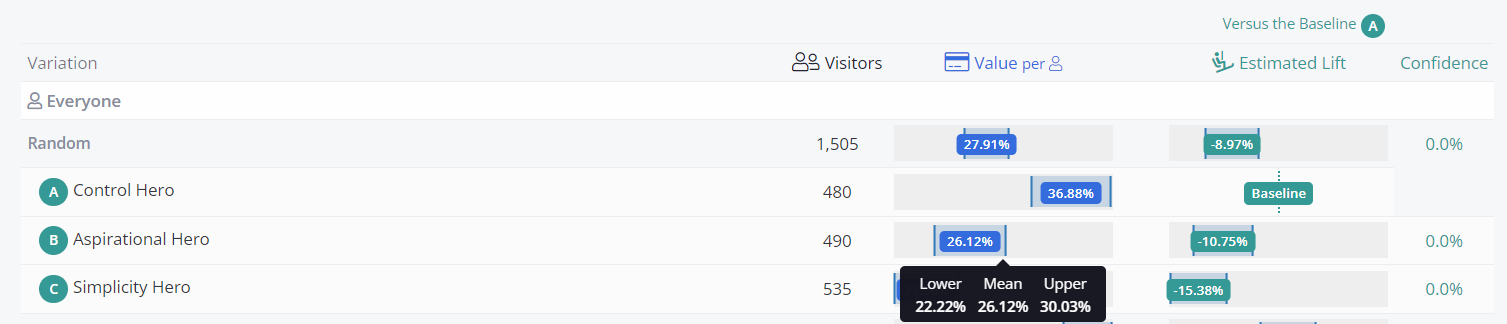
Value Per Selection - The value of all of the goals that have taken place after a variation was served. This is the performance measure used to evaluate the each variation combination. If the goal being used does not have a provided value, then this is the equivalent as the Conversion Rate of said goal, since we use "1" as the value of having converted. Included are upper and lower bars that indicates the expected high and low range that the estimated conversion values may take, also know as the Confidence Interval. Mousing over the Value will present these upper and lower values. (By default, the confidence interval is set to the 95% level. This can be adjusted in the account settings)
Estimated Lift - The absolute difference between each variation and the baseline. The lift is calculated as (Conversion Value Variation - Conversion Value Baseline).
Confidence - is a measure of how much evidence there is in the data to conclude that the test (the comparison between the variation and the baseline) is not just due to chance. Before running the test, the analyst should select a confidence level that must be reached in order to reach this conclusion. For example, a common confidence threshold is 95%. This roughly translates into a 5% chance that we would expect to see as large, or larger difference between the variation and the baseline, if there was really no difference between the two. (Please see our post on the meaning of P-values and running tests). For more technical users, note that the Confidence is 1 minus the p-value calculated from a Welch t-test. The Confidence value will also depend if using the One-Tailed or Two-Tailed setting.
Report Options
Data Set

From here you can pick which data bucket to use for the reporting. The Production bucket takes into account all the variation selections and goals that do not include the QA flag set to true. On the other hand, the QA bucket includes only those that do have it (The QA flag can be set in many ways on both Express and API implementations)
Date Range
You are able to view the report data based on custom date ranges.
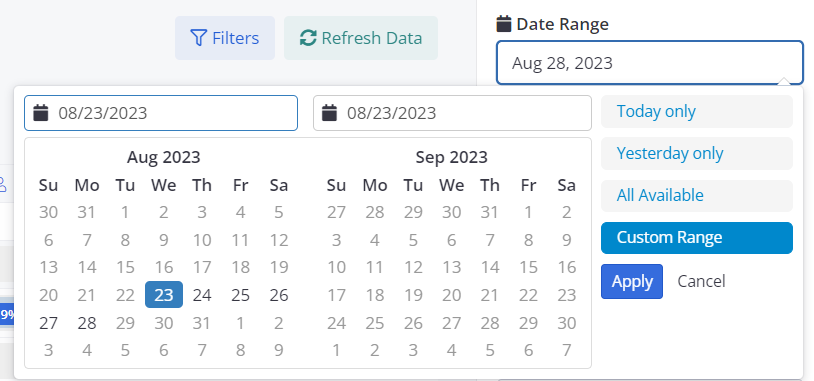
There are four options:
- Today - gives the current days results
- Yesterday - gives the previous days results
- All Available - presents all data collected over the life of the test
- Custom Range - select data over any contiguous range of dates
Visitor Traits
You may break out your test by visitor features by selecting the feature from the Visitor Traits selector. Checking the feature will expose the testing results for sessions that had the feature.
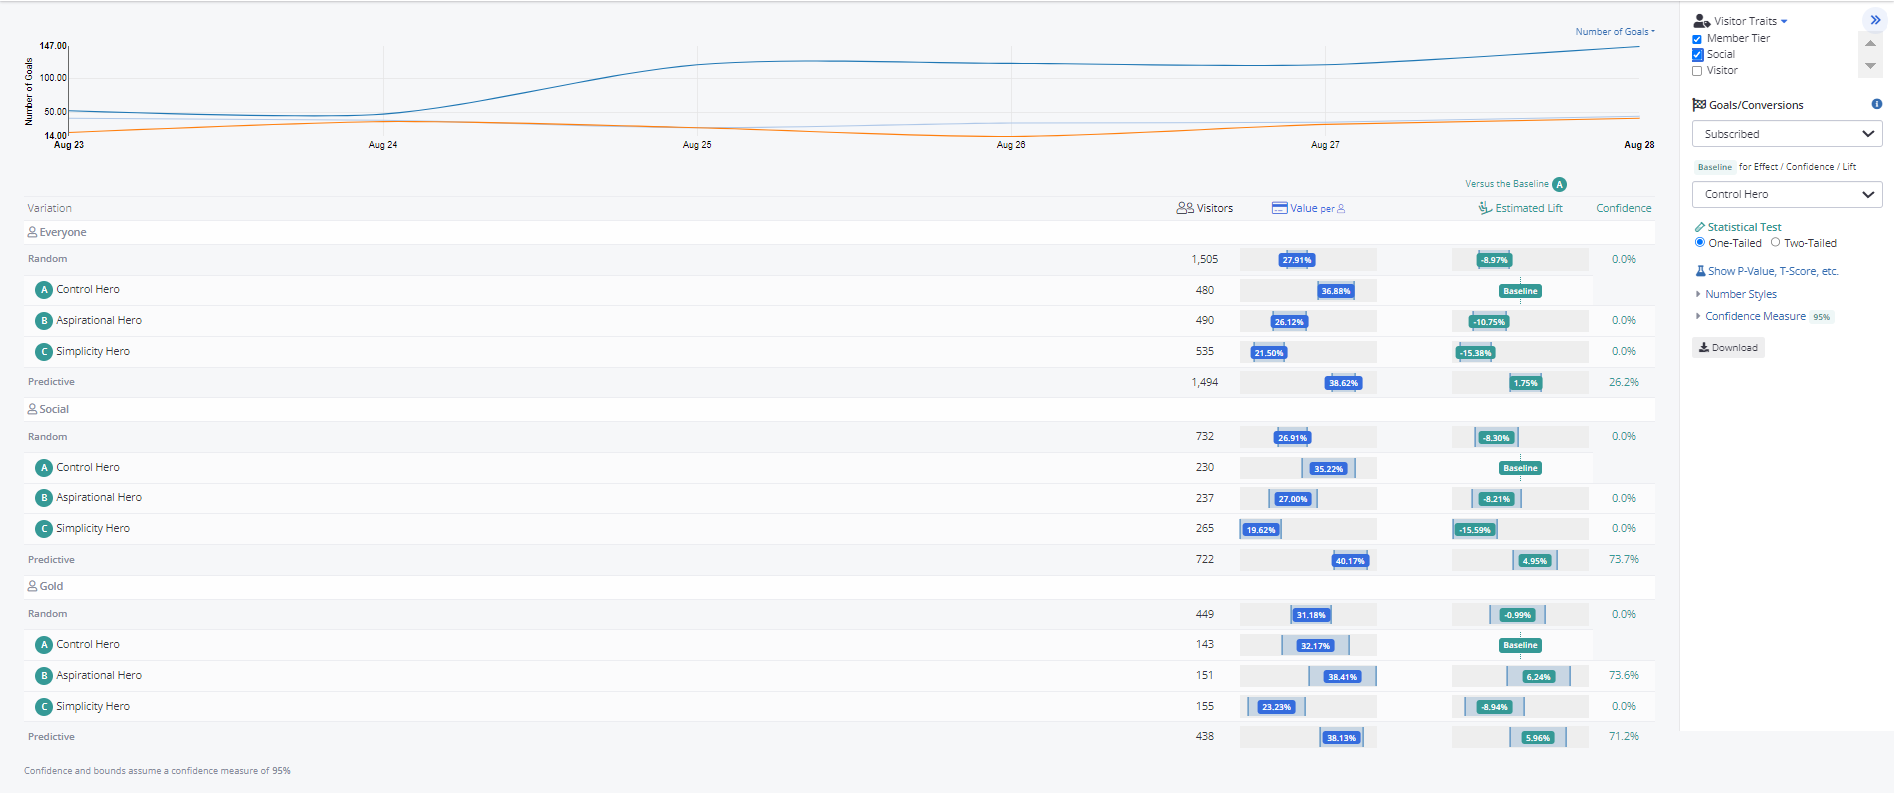
Some caution must be exercised when interpreting the broken out results, as with each increased break out there is a greater chance of finding a false positive result. These results should be considered exploratory analysis, unless the test was pre-determined to evaluate by the selected features.
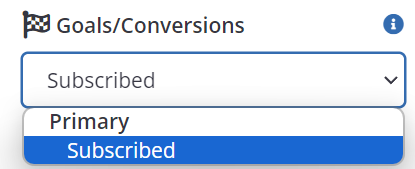
Goals / Conversions
By default, the test presents the results based on all goals. If you have multiple goals for a test, you may want to evaluate the results based on a particular, primary or secondary goal. Use this drop down to select the goal you would like the report to consider as the primary conversion event.
Baseline
By default, the first selection option is treated as the control baseline. However there may be times when you might prefer another option to be the baseline. For example, perhaps you are running a predictive agent, and you are interested in how much better the predictive results are than a Random selection, or the best performing individual option.
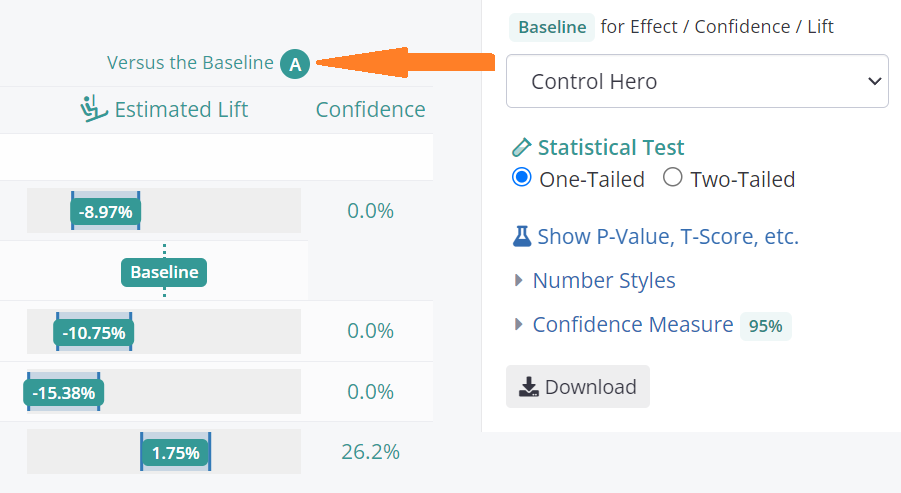
Statistical Test
The Statistical Test section gives you the option to decide if the test statistics should consider only one critical region (in the case of One-Tailed) or two (in the case of Two-Tailed).
Clicking on the Show P-Value, T-Score, etc option will expand the reporting, showing some new columns that include the data relevant to the test statistics such as the P-Value, T-Score, Degrees of Freedom and the Relative Lift (calculated as Conversion Value Variant - Conversion Value Baseline / Conversion Value Baseline ) .
Updated over 1 year ago