How Predictive Agents Work
Forget Dice, We Play Roulette
In this section we will walk through the basics of how Conductrics selects agent options when under the predictive policy (see Selection Policies for more detail around policies).
In a nutshell, Conductrics selects higher value options more often than lower valued ones.
How Conductrics makes its Selections
Predictive selection differs from random selection in that at selection time, Conductrics looks at all of the predicted values for each eligible decision option, and dynamically weighs the probability of selection to favor the higher value decision options. This has the effect of selecting options with higher predicted values more often, and selecting the lower values options less often.
To help visualize this, imagine a roulette wheel. Under a "fair" random policy, the roulette wheel has an equal area to each option, so each option has the same chance of selection. For three options, our roulette wheel would look something like this:
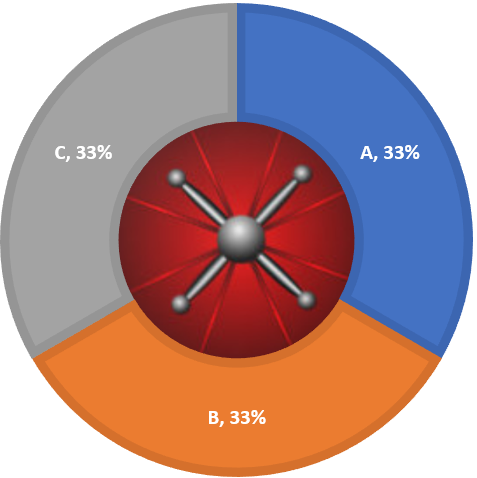
Each time we need to select a test option for a user, we spin the roulette wheel and select the option that the wheel stops on. Because each option has an equal share of the wheel, each option has an equal chance to be selected from each spin.
When in adaptive/predictive mode, Conductrics increases the probability of selections for the options that have higher predicted conversion values, and lowers the probability of options with lower predicted conversion values. This is equivalent to Conductrics constructing a biased roulette wheel to spin for its selections. For example, the roulette wheel below is biased such that option 'A' has a 63% chance of selections, while Options 'B' and 'C' have only 31% and 6% chance respectively.
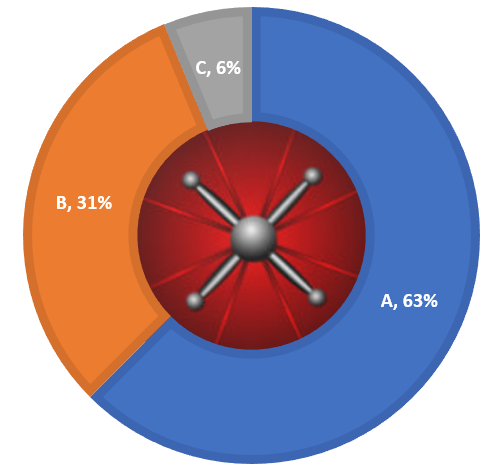
If we were to spin this wheel repeatedly, option 'A' would, on average, be selected 63% of the time, option 'B' 31%, and option 'C' only 6%.
Of course, this begs the question, 'how does Conductrics determine the weight for each option?'
From Bayesian AB Testing to Bandits: How Conductrics calculates the probabilities?
Conductrics uses a modified version of Thompson Sampling to make adaptive selections. Thompson sampling is an efficient way to approximate the probability that an option has the highest value over all of the possible options to select from. These estimated probabilities are analogues to the areas we assign to the our weighted roulette wheel.
Before we take draws using the Thompson sampling methods, we first need to construct a probability distribution over the possible conversion values for each option. How do we do that?
For those of you who already know about Bayesian A/B Testing, this section will be familiar. Without getting to much into the weeds (we will skip over the use and selection of the prior distribution), we will estimate both the conversion values and a measure of uncertainty (similar to standard error), and construct a probability distribution based on those values.
For example, lets say we were using conversion rate as a goal, and we had two options, each with a 5% conversion rate. However, for one option we have 3,000 observations (shown in grey below), and for the other we only have 300 observations (shown in blue). The option with 3,000 observations would have less uncertainty than the option with only 300.

The uncertainty of our estimates are encoded in the width, or spread of our distribution of the predicted values. Notice that the values for our first options are clustered between 4% and 6%, whereas our second option, while also centered at 5%, has a spread between 2% and 8%.
Let's say that rather than having the same conversion rate, we see a conversion rate of 5.5% for our second option. Now our distribution for Blue has been shifted slightly to right, as it is centered at 5.5%, rather than at 5%.

Just by looking at the two distributions, we can see that while Blue has a higher estimated conversion rate, there is so much uncertainty in Blue (as well as some in Grey), that we can't really be too certain which option is the better one.
One simple approach to get an idea of how likely Blue is actually going to be better than than Grey is to take random draws from each distribution, compare the results, and then mark how often the result from Blue was greater than Grey. If we did this, say 10,000 times, we would find that Blue was better 62% of the time. We would then conclude, that based on the data so far, Blue has an approximately 62% chance of being best. Which means that Grey still has a non trivial 38% chance to actually be the better option.
Advanced: Priors and AB TestingIf you have experience with Bayesian A/B Testing, you may be wondering about the selection of the prior distribution. Conductrics recommends the use of our A/B Testing Report to evaluate A/B Tests (t-tests for error control), rather than using the predicted posterior distribution found in the audience reports described on this page.
The values in the audience report will often align with Bayesian A/B Testing calculators, however Conductrics uses an approximate empirical Bayesian approach to estimate the prior distributions. This can lead to significantly different results than those found in online testing calculators (which tend to use a uniform prior). Please see our Post on Shrinkage if you would like to learn more.
Thompson Sampling and Bandit Selection
We can also use Thompson Sampling to actually make the selections for each user. We can take random draws from each of the option's associated distribution and then select the option for which we drew the highest value. That is all there is to it.
To make this clearer, lets take a look at an example. Below we have three options, each with their associated posterior distributions over their predicted conversion value. Thompson Sampling implicitly makes draws based on the probability that each is best by taking random draws from each of the three options, and then selecting the option with the highest valued draw.
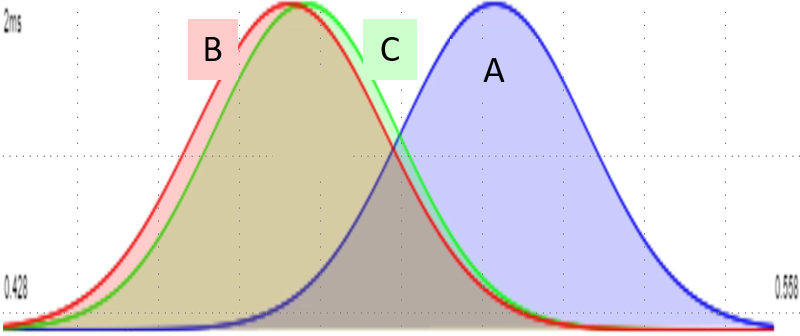
Lets now take a random draw from the distributions of each option. Notice that even though 'A' has a higher predicted value ('A' is shifted to the right of the both 'B' and 'C'), some of the left hand side of the distribution overlaps with the right hand sides of both 'B' and 'C'. Since the width of the distribution indicates our uncertainty around the predicted value (the more uncertain, the wider the distribution), it is possible that either options B or C are the best, but while possible, they are less likely than 'A' to be the best option.

In this case, we see that our draw from 'B' happened to have the highest value (0.51 vs. 0.49 and 0.46). So we would select 'B' for this particular request.
This process is repeated with each selection request. If we were to get another request we might get draws such that 'A' was best.

Over repeated draws, the frequency that each option is selected will be constant with the probability that the option is the best one.

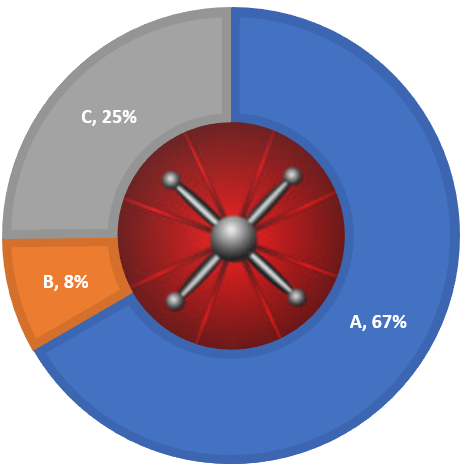
So in our example, we would select 'A' approximately 67% of the time, 'B' 8% of the time, and 'C' 25% of the time. If we again drew this as a roulette wheel, it would look like this:
Where can I see these results in the Reporting?
Conductrics provides reporting and data visualizations based on data from your own experiments and adaptive projects.
If you head over to the audience report you will be see both the predicted value of each option, but also the probability that the selection is best (represented by the heights of the bars). For example, the report below shows that after 10,000 visitors, option 'A' has a predicted value of 4.96% and a 67% change to be a better option than both 'B' and 'C'.

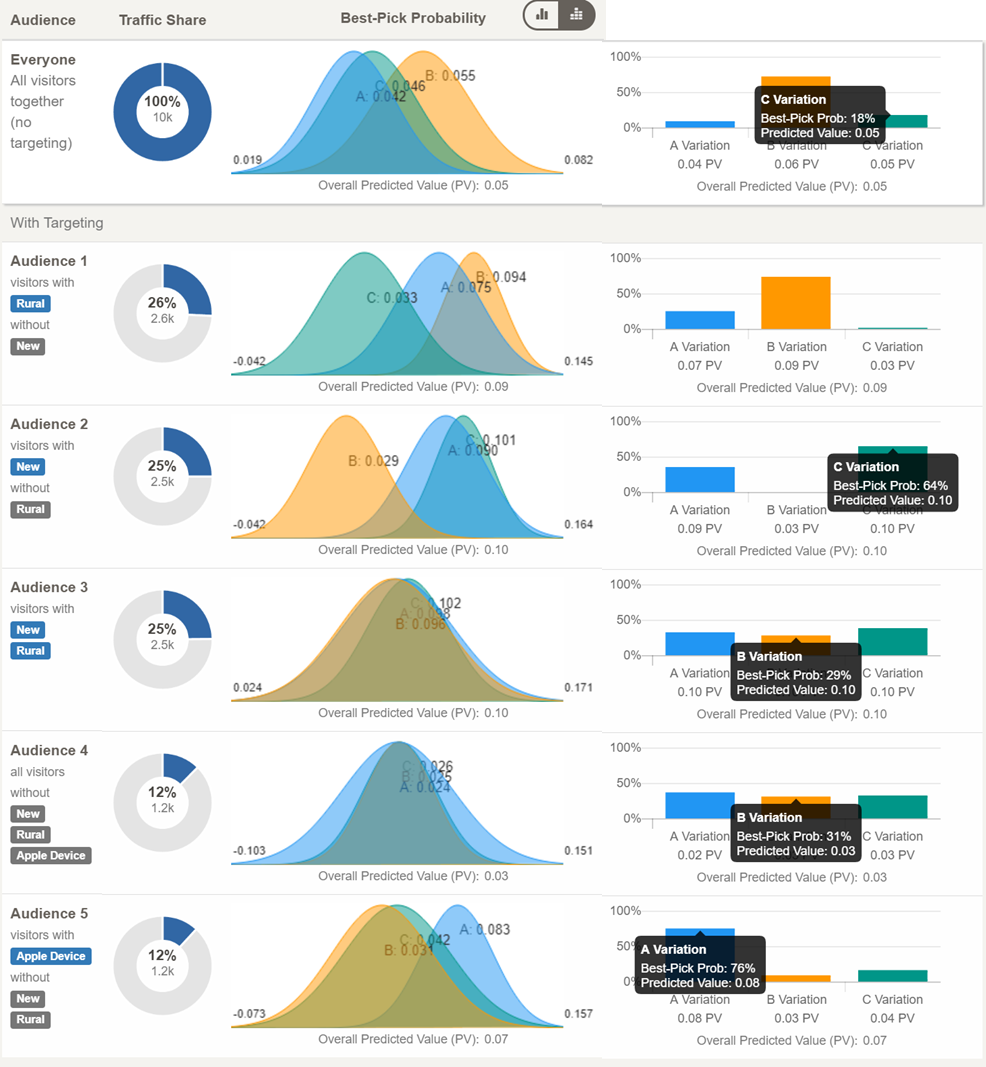
We also provide a data visualization view that displays the posterior distributions that Conductrics uses in the Thompson Sampling draws.

This is the same data as before, but with a slightly different view. Now, instead of the bar chart showing the chance that each option is the best, there are the actual distributions that are used to make the adaptive selections.
This view can be useful to help understand why an option won't always be selected, even though it has a higher predicted value than the others. The width of the distributions give you an idea of the relative uncertainty in the data around the predicted values, and the greater degree of overlap indicates how much uncertainty there is between which option to select.
Adaptive Selection with Predictive Targeting
Conductrics also uses the same Thompson Sampling approach for targeting.
When Conductrics determines that a user feature or trait is useful, it recalculates both the predicted values as well as the probabilities that each option is best. In the example below, visitors on Apple Devices have a much higher predicted value under the 'A' option than either the 'B' or 'C' options. So much so that if Conductrics was to select options for users on Apple Devices, the 'A' option would nearly always get selected.
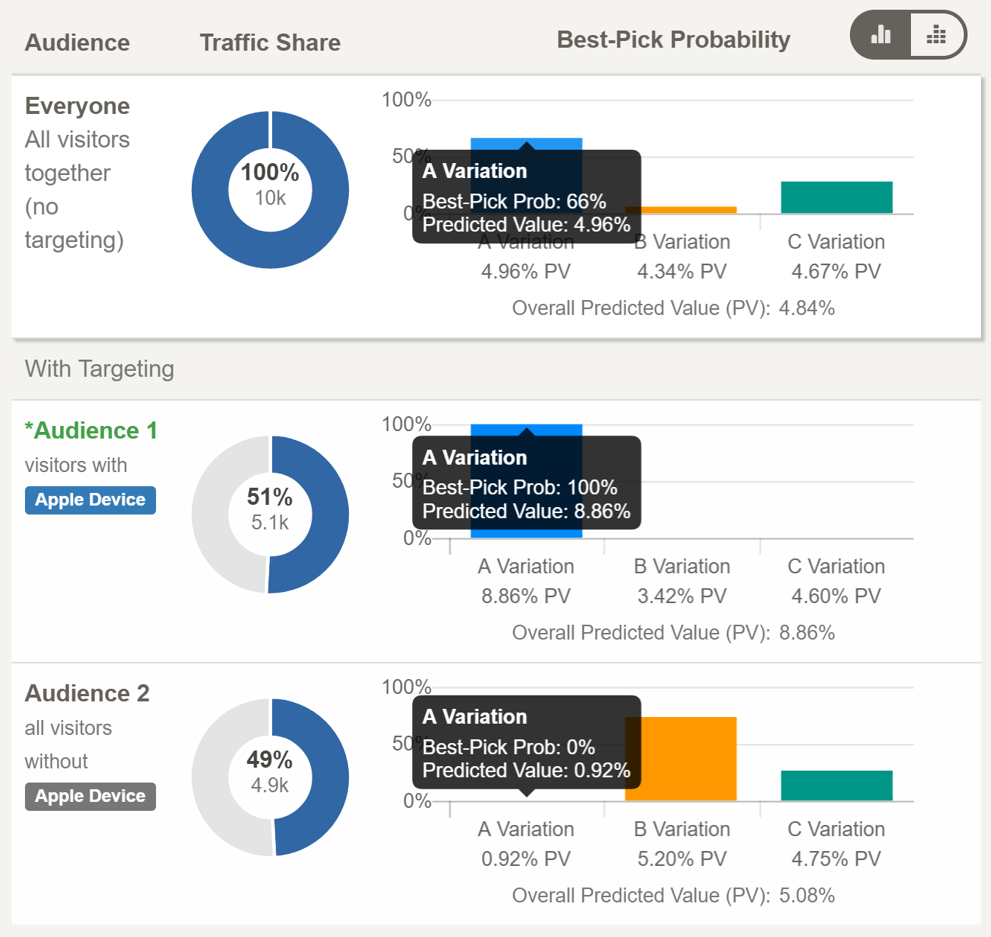
However, for users not on Apple Devices, option 'A' performs much worse that either option 'B' or 'C', and hence, will hardly ever be selected ('A' Best-Pick Prob=0%).
You will notice that you still have access to the 'Everyone' audience. This way you can see how well each options performs overall, and what the overall probability of selection would be without any targeting. You can also see the visualization of the posterior distributions for each option, in each audience.

Now that you understand Thompson sampling, it becomes clear why for Apple Device users, option 'A' has essentially a 100% chance of being selected.
Even if we were to always pick from the very left hand side (low value side) from option 'A', and always picked from the right hand side (high value side) from both 'B' and 'C', option 'A' would still almost always have a higher value. For visitors not on Apple Devices, the reverse is true. Even if we were to use the most optimistic draws from option 'A' and the most pessimistic draws from 'B' and 'C', option 'A' would still produce draws that were less than those from 'B' and 'C'.
If Thompson sampling and posterior distributions are tripping you up, you can also just think of it as Conductrics creating a different roulette wheel for each audience. When a member of that audience enters into an agent, Conductrics will first check which wheel to use, and then spin that wheel in order to make a selection for them. So based on the audience report for Apple and non-Apple Device users, the logic would look like:

In a way, when you peel back all of the clever machine learning and multi-armed bandit logic, all Conductrics is really doing is constructing these targeted roulette wheels, and using them to select experiences for your users.
Audiences
You are not limited to just simple segments for use with adaptive selection. If the data support it, Conductrics will build ever more specific audiences. Each of these audiences will have its own predicted values and probabilities to be the best for each option/variation.
For example, in addition to the Apple Device visitor trait, the data might support the inclusion of 'New' customers, and customers for small towns and rural areas - which we have encoded as 'Rural' visitors. In this situation, the Audience decision tree might look something like the following

Here we see that 'Rural' Customers was the first user trait that Conductrics Machine Learning selected as the most important. Then 'Rural' customers were included. Finally 'Apple Devices' were added, but only for for the customers that where both not 'New' (Repeat) and not 'Rural'. For all other customers, based on the data, knowing if they were on an Apple device was not considered useful in deciding between selection among the three options.
Looking at the List View of this same tree - we can see that each option, for each experience, has a predicted value and a probability to be best. Conductrics generates a probability distribution for each option in each audience, and uses it to calculate the probabilities within each audience.
Limiting The Model SizeConductrics uses a varieties of internal methods (learning rates, epoch limits/early stopping, empirical Bayes & Shrinkage, as well as hard limits on both the number of audiences and minimum number of customers per audience. These limits are used to reduce the risk of over-fitting, and generating overly complex models, that require more visitor traits as inputs, while not yielding much added marginal benefit. These are configurable in the advanced settings. Please contact Conductrics for help when considering altering the default settings.
One last thing: Uniform Selection
Even when the agent is set to make adaptive selection, there is still a portion of the traffic that is assigned by our fair roulette wheel. The default is 20%. The reason for dong this is twofold:
-
To ensure a random baseline. In order to evaluate the efficacy of adaptive learning, it is important to ensure there is an unbiased comparison group to compare the results against (see our A/B Testing Report.
-
To ensure that Conductrics still tries out all of the options in case there is some external change, or seasonality effect, that might cause a change in the conversion rate/value of the decision options.
Updated over 1 year ago