Audience Report
Conductrics’ Audience report is where AB Testing merges with predictive targeting in order to discover which experiences are best for each type of customer.
What does the Audience report tell me?
The Audience report will tell you the following:
- Which targeting features are most important for predicting which experiences are best for a user.
- What the targeting rules Conductrics has learned and currently thinks are best
- The predicted value of each experience in for each audience.
- The probability that each option is best for a particular audience
Navigating the Audience Report
There are two primary views for the Audience report, the Tree View and the List View.
Tree View

The Audience report tree views displays a graphical representation what features have been included in building the audiences. The report can be read either top to bottom or, by changing the orientation, from left to right.

To understand how Conductrics selects features to include, one way is to think of it like a game of 20 questions. The Audience builder starts with everyone in one big group.

We see that 100% of all of the customers are in a single audience. Then, as you start running your agent, and start collecting data, the audience builder inspects the predictive models and asks itself, if I could only know one thing about a user, what one thing would be MOST valuable to in discriminating which experiences should go to which customers?.
If there is enough data, the Audience builder selects that feature and splits the the customers into two new groups, one with the feature and one without.

The 'No' indicates that that branch of users does not have the feature. The 'No' splits are always either on the left for the top down orientation or on the top when the orientation is left to right.
In our example above, the audience builder has selected 'New' Visitor the make the initial split. We see that 30% of our customers are not new, and 70% of them are.
After making the first split, the audience builder then determines if it can split the new audiences some more by seeing if there is another feature that is valuable to split again. If there arn't any more features that are useful and there is enough data for, then the process stops and the new tree is finished. The Builder will then wait until more data has been collected, and then rebuild the tree using the new data.

It is possible that after more data has been collected, that the Audience builder will discover that different features are actually more useful to segment the customers. In the above report, the builder has swapped in 'Rural' visitors as the most useful feature. Customers that are not Rural (the left side of the tree), can be further split into 'Not Rural + Not New' customers and 'Not Rural + New' customers.

After collecting more data the builder finds that 'New' customer is useful for splitting the Rural customers as well.
Audience Detail
The tree view is useful to see at a glance which features are important, how related each audience is to the other audiences, and the relative size of each audience. To select the details for an audience click on the appropriate portion of the the tree.
Below we have selected Audience #3 from the left most branch of the tree.

By selecting the audience from the tree, a detail report is displayed. Reading from left to right, the detail report contains the following
Audience Definition
Each audience is defined by a collection of active and inactive features. Audience #3 is defined as all visitors that are not Rural AND not New visitors.
Traffic Share
The traffic share section provides both the raw count and the percentage of customers that meet the audience definition. For example, Audience #3 has 503 customers that meet this criteria, which is roughly 21% of all traffic collected for the agent.
Best-Pick Probability
This is the real meat of the report. The bar graph displays the predicted values of each experience along the horizontal axis. The height of the bar graph represents the probability that each experience is the best one for the audience. For example, for audience #3 experience 'A' has a predicted conversion rate of 24.38%, 'B' a conversion rate of 18.91%, and 'C' a conversion rate of 21.92%. Even though 'A' has the highest predicted value, we have only seen 503 users in this segment, ans so we are not totally certain what the true conversion rate is for each option.
The Best-Pick probability, incorporates this uncertainly to give us a score that predicts which option is best. In Audience #3 'A', not surprisingly, has the highest probability of being best, 62%. 'C', which has the next highest conversion rate has a probability of 30%, and 'B', with the lowest conversion rate, has only an 8% of turning out to be the highest value option.
List View
While the tree view is very useful to see how the audience are related to one another, the list view is useful when we want to compare the details of each audience against the others.
If we toggle our current tree to list view the report presents a flattened view with the detail of each audience in a list.
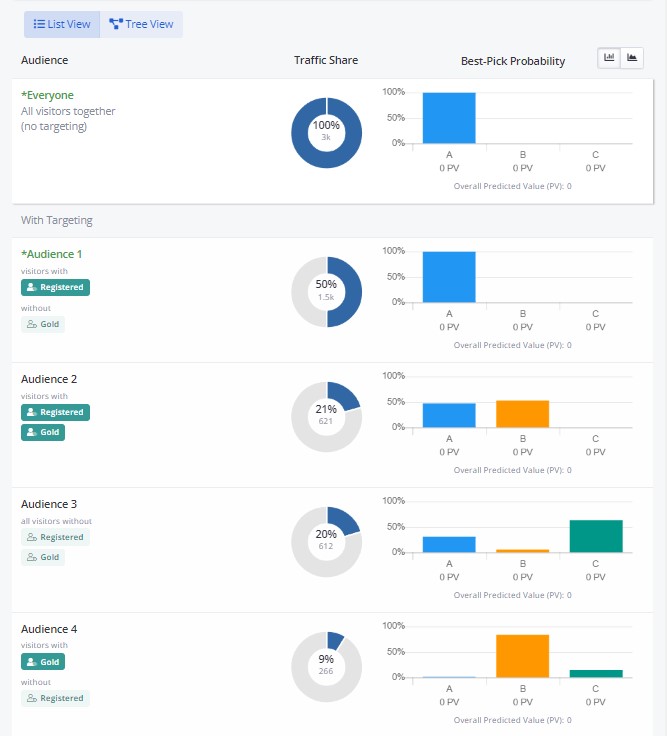
Now we can see at a glance that option 'B' is predicted to be best for both Audience #2 (with 53% probability) and Audience #4 (with 84% probability). Option 'A' is leading in Audience #1 (with 100% probability) and at last Option 'C' leads on Audience #3 with 63% probability.
Another way to look at the audience report, is to think of each audience detail as a decision rule that was generated by Conductrics' machine learning. Audience #1 then can be recast as Rule #1 which states the IF customer is 'Registered' AND not 'Gold' then select 'A'. We can then expect that this rule will fire roughly 50% of the time.
Updated over 1 year ago